Blog o spekulacjach giełdowych i analizach

Codzienne wykresy, podsumowania i analizy moich transakcji giełdowych.

O nas - blog spekulanta giełdowego

Witaj na moim blogu, gdzie dzielę się analizami i wykresami moich codziennych transakcji giełdowych. Razem odkryjemy tajniki spekulacji i strategii inwestycyjnych.

A laptop displays a financial trading platform with a candlestick chart showing stock market data. The chart is colorful, with blue and orange bars representing volume, and fluctuating lines indicating stock prices over time. Surrounding the laptop are two small potted plants on a white surface.
Świetna inicjatywa!

Marek K.

"
A person holds a smartphone displaying a stock market trading app with candlestick charts. A laptop is on a wooden table with a similar financial chart, indicating active trading or analysis. The setting suggests a home office or casual workspace.

Galeria

Zobacz moje analizy i wykresy z sesji giełdowych.

A hand holding a smartphone displaying a stock trading chart with details on stock prices. The phone is above a wooden table where a blurred laptop screen in the background shows similar financial data. Natural light comes in from the window, creating a relaxed working environment.
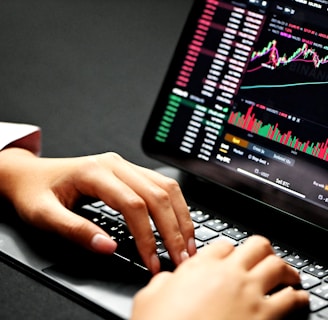
Hands typing on a laptop keyboard with a screen displaying financial graphs and stock market data. Multiple charts and numbers are visible, indicating online trading or financial analysis.
A tablet displaying a detailed digital financial trading interface with various graphs, charts, and numerical data. The screen shows candlestick charts with green and red indicators, illustrating market trends and stock prices.

Kontakt z intratrader.pl

Masz pytania? Skontaktuj się ze mną, chętnie odpowiem na wszystkie wątpliwości dotyczące moich analiz i strategii giełdowych.

Zapytania

1234567890

Wsparcie

kontakt@intratrader.pl